In this article I am going to show you how you can Monitor Docker Using Telegraf and Grafana. Let us begin with a quick official intro about what is Telegraf, InfluxDb and Grafana.
As mentioned in official docs, Telegraf is a plugin-driven server agent for collecting and sending metrics and events from databases, systems, and IoT sensors. Telegraf is written in Go and compiles into a single binary with no external dependencies, and requires a very minimal memory footprint.
Wikipedia Definition, InfluxDB is an open-source time series database. It is developed by InfluxData. It is written in Go and optimized for fast, high-availability storage and retrieval of time series data in fields such as operations monitoring, application metrics, Internet of Things sensor data, and real-time analytics.
As mentioned in Grafana Official Docs, Grafana has become the world’s most popular technology used to compose observability dashboards with everything from Prometheus & Graphite metrics, to logs and application data to power plants and beehives.
So in short we can say that we will be using Telegraf to monitor Docker. Telegraf will then send these data to InfluxDB for storing which further will be queried by Grafana to visualize data and create awesome dashboards.
Get 5+ Hours of complete Grafana Course at Special Price on Udemy
Installing Telegraf, InfluxDb and Grafana
Please watch this video to know how to install Telegraf, InfluxDB and Grafana. In this article we are just going to concentrate on enabling Monitoring of Docker using Telegraf.
Telegraf configuration for Monitoring Docker
01: Create a file named “/etc/telegraf/telegraf.d/docker_monitor.conf“
02: Add below configuration in docker_monitor.conf file
[[inputs.docker]]
endpoint = "unix:///var/run/docker.sock"03: Restart Telegraf by using below command:
sudo systemctl restart telegraf
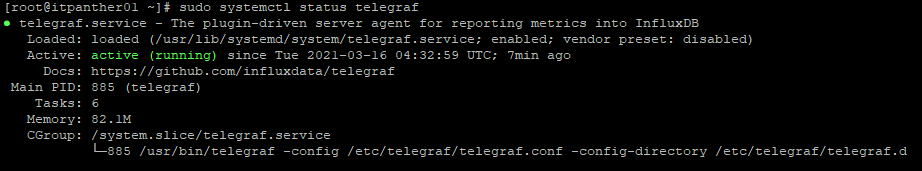
Step 4: Check status of Telegraf to make sure it is running properly and you did not receive any errors.
If there is any error that permission denied for accessing docker.sock it means you need to run below command as well to set appropriate permission and restart Telegraf.
sudo chmod 666 /var/run/docker.sock
Checking Docker Database in InfluxDB
We are now going to check InfluxDB to ensure Docker Database is already created in InfluxDB. You can do it by running below commands on the server where InfluxDB is available.
influx
show databases