Grafana Rest APIs are a very important topic for engineers who are leveraging the power of the Grafana tool in their IT environment. Whenever you perform any action using Grafana APIs, behind the scene Grafana calls the REST APIs to process the requests. It means we can call those APIs directly without the need of requiring to interact with Grafana GUI.
What is an API?
If you are a beginner in the world of IT then you might not be aware of what exactly is an API (Application Programming Interface). So I am leaving a link to the video which you can watch if you are an absolute beginner. If you already know what an API is then please move on to the next section.
Why should you use Grafana Rest APIs?
There are various reasons to use Grafana Rest APIs, especially if you are an admin. As a Grafana admin, your job would typically involve taking care of the health of Grafana, creating users in Grafana, deleting users, etc. These tasks are quite repetitive in nature and you would typically like to automate such tasks. So with the power of Grafana Rest APIs, you would be able to automate such tasks with easy and can go home early. Here are the things you can manage using Grafana Rest APIs:
- Admin API
- Alerting Notification Channels API
- Alerting API
- Annotations API
- Authentication API
- Dashboard API
- Dashboard Permissions API
- Dashboard Versions API
- Data source API
- Folder API
- Folder Permissions API
- Folder/Dashboard Search API
- Library Element API
- Organization API
- Other API
- Playlists API
- Preferences API
- Short URL API
- Snapshot API
- Team API
- User API
Connecting to Grafana using Rest APIs
There are two methods available when you connect to Grafana using Rest APIs. The first one is called Basic Authentication and the other one is known as Token based authentication.
There are some actions that you can only perform by using the Basic Authentication method while others can be performed by either using Token Based or Basic Authentication method.
Installing Grafana on Docker Play
PWD (Play With Docker) is a Docker playground that allows users to run Docker commands in a matter of seconds. It gives the experience of having a free Alpine Linux Virtual Machine in the browser, where you can build and run Docker containers and even create clusters in Docker Swarm Mode.
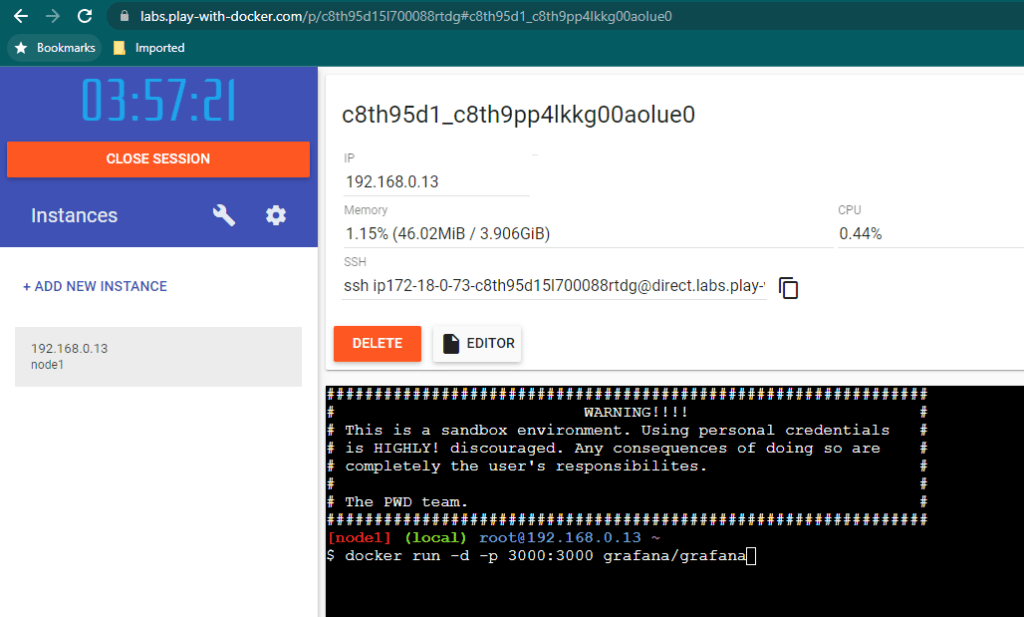
Please create your account in Play With Docker and after you login, you can click on “Add New Instance”. Once the new instance is opened you can type below command to launch Grafana:
docker run -d -p 3000:3000 grafana/grafana
Once Grafana is installed, you will see a link to port 3000 as shown in the screenshot below. Click on that link and you will see the newly installed Grafana login screen.
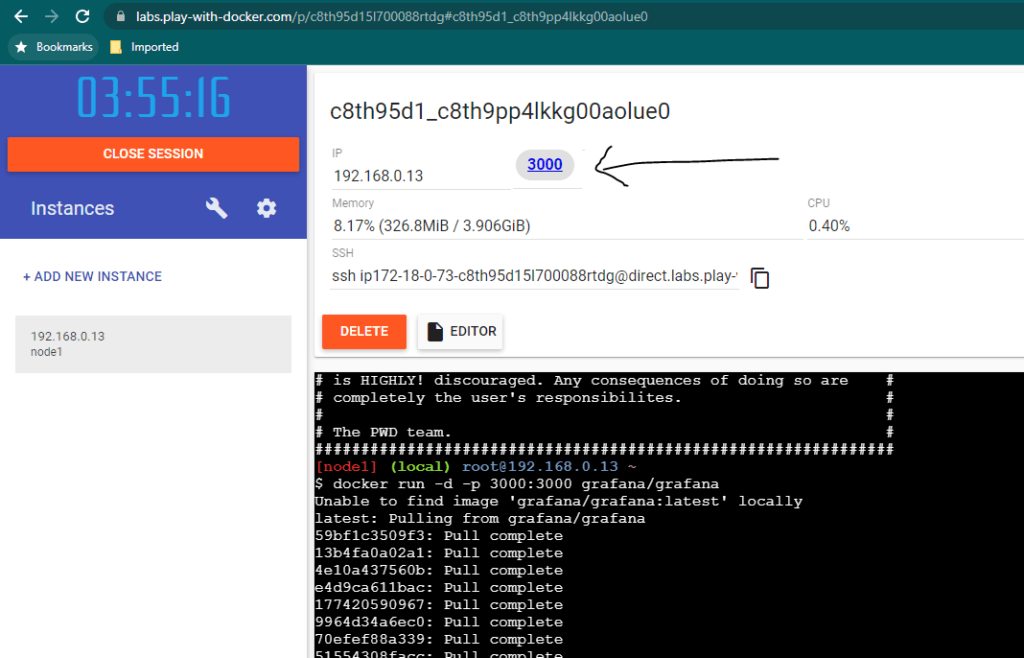
You can notice that Grafana URL will be looking something like below. We will be using this URL throughout the course to interact with Grafana using Grafana Rest APIs.
http://ip172-18-0-29-c8tflv14lkkg00aolq2g-3000.direct.labs.play-with-docker.com/
Grafana API Authentication
Grafana API Basic Authentication
If you are following the Grafana Basic Authentication approach, you will have to pass Grafana’s username and password in the URL itself. Below is a sample python program using Grafana Basic Authentication:
import requests
import json

base_url = "http://admin:admin@ip172-18-0-29-c8tflv14lkkg00aolq2g-3000.direct.labs.play-with-docker.com"

resp = requests.get(base_url + "/api/dashboards/home", verify=False)

data = resp.json()
data
Please note that default credentials for Grafana is as below:
Username: admin
Password: admin
Grafana API Token Authentication
In order to connect to Grafana using Token Authentication, first, you will have to create a token/key. You can do this by logging into Grafana and going to Configuration->API Keys
If an API key is successfully created, you should be able to see something similar to below screen:
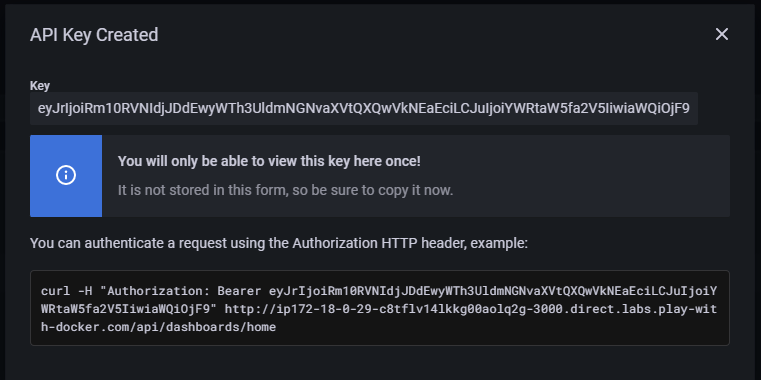
You can use below sample Python program now to connect to Grafana.
import requests
import json

headers = { "Authorization" : "Bearer eyJrIjoiTnlrUnlLM0QwTUFTZzZZWnV1TGhlWmhOQlBxN0NUcWEiLCJuIjoiYWRtaW5fYXBpX2tleSIsImlkIjoxfQ==",
    "Accept" : "application/json",
    "Content-Type" : "application/json"
}

base_url = "http://ip172-18-0-29-c8tflv14lkkg00aolq2g-3000.direct.labs.play-with-docker.com"

resp = requests.get(base_url + "/api/dashboards/home", verify=False, headers=headers)

data = resp.json()
data
Grafana Admin APIs
If you want to see all the settings of Grafana then you can use /api/admin/settings API. Please refer to the below sample command. This will show you all the settings which you see when you go to Grafana -> Server Admin -> Settings from Grafana GUI.
Before running the below python program, please make sure to change grafana_url, username, and password to the actual value of your environment.
import requests
import json

grafana_url = "ip172-18-0-23-c8vdq1g9jotg00duhte0-3000.direct.labs.play-with-docker.com"
username = "admin"
password = "admin"

base_url = "http://{}:{}@{}".format(username, password, grafana_url)

resp = requests.get(base_url + "/api/admin/settings", verify=False)
data = resp.json()
data
Grafana Stats API
Grafana Stats API is quite useful if you want to monitor Grafana instances. You can use /api/admin/stats API to get these details. I would generally recommend saving these details in a data source and then creating some Grafana dashboard and enabling alerting mechanism to get more benefit out of this API.
import requests
import json

grafana_url = "ip172-18-0-23-c8vdq1g9jotg00duhte0-3000.direct.labs.play-with-docker.com"
username = "admin"
password = "admin"

base_url = "http://{}:{}@{}".format(username, password, grafana_url)

resp = requests.get(base_url + "/api/admin/stats", verify=False)
data = resp.json()
data
The sample output of the command will be the below details. Please note that the actual value which you get will be different, and it will be based on your Grafana environment.
{
  "users":2,
  "orgs":1,
  "dashboards":4,
  "snapshots":2,
  "tags":6,
  "datasources":1,
  "playlists":1,
  "stars":2,
  "alerts":2,
  "activeUsers":1
}
Grafana Usage Report
Grafana usage report API is quite useful when you want to get data related to Grafana’s usage statistics. You can get this data by running /api/admin/usage-report-preview API. It can show you useful things like total active users, total active sessions, and so on.
import requests
import json

grafana_url = "ip172-18-0-23-c8vdq1g9jotg00duhte0-3000.direct.labs.play-with-docker.com"
username = "admin"
password = "admin"

base_url = "http://{}:{}@{}".format(username, password, grafana_url)

resp = requests.get(base_url + "/api/admin/usage-report-preview", verify=False)
data = resp.json()
data
The sample response of the above command would be something similar to as shown below.
{'arch': 'amd64',
 'edition': 'oss',
 'hasValidLicense': False,
 'metrics': {'stats.active_admins.count': 1,
  'stats.active_editors.count': 0,
  'stats.active_sessions.count': 0,
  'stats.active_users.count': 1,
  'stats.active_viewers.count': 0,
  'stats.admins.count': 1,
  'stats.alert_rules.count': 0,
  'stats.alerting.ds.other.count': 0,
  'stats.alerts.count': 0,
  'stats.annotations.count': 0,
  'stats.api_keys.count': 1,
  'stats.auth_enabled.anonymous.count': 0,
  'stats.auth_enabled.auth_proxy.count': 0,
  'stats.auth_enabled.basic_auth.count': 1,
  'stats.auth_enabled.ldap.count': 0,
  'stats.auth_enabled.oauth_azuread.count': 0,
  'stats.auth_enabled.oauth_generic_oauth.count': 0,
  'stats.auth_enabled.oauth_github.count': 0,
  'stats.auth_enabled.oauth_gitlab.count': 0,
  'stats.auth_enabled.oauth_google.count': 0,
  'stats.auth_enabled.oauth_grafana_com.count': 0,
  'stats.auth_enabled.oauth_okta.count': 0,
  'stats.auth_token_per_user_le_12': 1,
  'stats.auth_token_per_user_le_15': 1,
  'stats.auth_token_per_user_le_3': 1,
  'stats.auth_token_per_user_le_6': 1,
  'stats.auth_token_per_user_le_9': 1,
  'stats.auth_token_per_user_le_inf': 1,
  'stats.avg_auth_token_per_user.count': 1,
  'stats.daily_active_admins.count': 0,
  'stats.daily_active_editors.count': 0,
  'stats.daily_active_sessions.count': 0,
  'stats.daily_active_users.count': 1,
  'stats.daily_active_viewers.count': 0,
  'stats.dashboard_permissions.count': 0,
  'stats.dashboard_versions.count': 0,
  'stats.dashboards.count': 0,
  'stats.dashboards_viewers_can_admin.count': 0,
  'stats.dashboards_viewers_can_edit.count': 0,
  'stats.datasources.count': 0,
  'stats.distributor.grafana-labs.count': 1,
  'stats.ds.other.count': 0,
  'stats.edition.enterprise.count': 0,
  'stats.edition.oss.count': 1,
  'stats.editors.count': 0,
  'stats.encryption.current_provider.secretKey.count': 1,
  'stats.encryption.envelope_encryption_enabled.count': 0,
  'stats.folder_permissions.count': 0,
  'stats.folders.count': 0,
  'stats.folders_viewers_can_admin.count': 0,
  'stats.folders_viewers_can_edit.count': 0,
  'stats.library_panels.count': 0,
  'stats.library_variables.count': 0,
  'stats.live_clients_avg.count': 1,
  'stats.live_clients_max.count': 1,
  'stats.live_clients_min.count': 0,
  'stats.live_samples.count': 1,
  'stats.live_users_avg.count': 1,
  'stats.live_users_max.count': 1,
  'stats.live_users_min.count': 0,
  'stats.monthly_active_users.count': 1,
  'stats.orgs.count': 1,
  'stats.oss.accesscontrol.enabled.count': 0,
  'stats.packaging.docker.count': 1,
  'stats.playlist.count': 0,
  'stats.plugins.apps.count': 0,
  'stats.plugins.datasources.count': 21,
  'stats.plugins.panels.count': 31,
  'stats.provisioned_dashboards.count': 0,
  'stats.snapshots.count': 0,
  'stats.stars.count': 0,
  'stats.teams.count': 0,
  'stats.total_auth_token.count': 1,
  'stats.uptime': 2179,
  'stats.users.count': 1,
  'stats.valid_license.count': 0,
  'stats.viewers.count': 0},
 'os': 'linux',
 'packaging': 'docker',
 'usageStatsId': '145bc554-6ee5-405c-b923-1488188541b2',
 'version': '8_4_4'}
Grafana API to create a user
You can use the below API to create a user in Grafana. Please pay attention that in this call we need to make a POST request. Additionally, by default the created user will have viewer access, If you want to give admin access then you can also pass “isGrafanaAdmin”: True in the data. Refer to below sample python programs for both cases.
Create a user with Viewer Role.
import requests
import json

grafana_url = "ip172-18-0-23-c8vdq1g9jotg00duhte0-3000.direct.labs.play-with-docker.com"
username = "admin"
password = "admin"

base_url = "http://{}:{}@{}".format(username, password, grafana_url)

data = {
  "name":"User1",
  "email":"[email protected]",
  "login":"user1",
  "password":"userpassword",
  "OrgId": 1

}


resp = requests.post(base_url + "/api/admin/users", json=data, verify=False)
data = resp.json()
data
Create a user with Admin Role.
import requests
import json

grafana_url = "ip172-18-0-23-c8vdq1g9jotg00duhte0-3000.direct.labs.play-with-docker.com"
username = "admin"
password = "admin"

base_url = "http://{}:{}@{}".format(username, password, grafana_url)

data = {
  "name":"User1",
  "email":"[email protected]",
  "login":"user1",
  "password":"userpassword",
  "OrgId": 1,
  "isGrafanaAdmin": True
}


resp = requests.post(base_url + "/api/admin/users", json=data, verify=False)
data = resp.json()
data
Changing password of any user
As a Grafana administrator it is quite common that you will be getting a lot of request where team members are requesting you to change the password of their user. You can achieve this by running below API.
import requests
import json

grafana_url = "ip172-18-0-23-c8vdq1g9jotg00duhte0-3000.direct.labs.play-with-docker.com"
username = "admin"
password = "admin"

base_url = "http://{}:{}@{}".format(username, password, grafana_url)

data = {
 "password":"newPassword" }


resp = requests.put(base_url + "/api/admin/users/2/password", json=data, verify=False)
data = resp.json()
data
Grafana API to Delete a user
import requests
import json

grafana_url = "ip172-18-0-23-c8vdq1g9jotg00duhte0-3000.direct.labs.play-with-docker.com"
username = "admin"
password = "admin"

base_url = "http://{}:{}@{}".format(username, password, grafana_url)


resp = requests.delete(base_url + "/api/admin/users/2", verify=False)
data = resp.json()
data