In the realm of observability and monitoring, Prometheus and Grafana stand out as two powerful tools that play complementary roles in ensuring the reliability and performance of systems. While Prometheus excels in data collection and alerting, Grafana shines in data visualization and analysis. In this article, we’ll delve into the key features, strengths, and differences between Prometheus and Grafana, providing insights to help you choose the right tool for your monitoring needs.
Understanding Prometheus
Prometheus is an open-source monitoring and alerting toolkit originally built at SoundCloud. It is designed for reliability, scalability, and flexibility in monitoring dynamic cloud-native environments. Prometheus follows a pull-based model, where it scrapes metrics from instrumented targets at regular intervals.
- Data Collection: Prometheus collects time-series data through HTTP endpoints exposed by services, exporters, and other sources. It can scrape metrics from various systems, including containers, Kubernetes, databases, and more.
- Query Language: Prometheus Query Language (PromQL) allows users to perform powerful queries on collected data, enabling advanced aggregation, filtering, and analysis.
- Alerting: Prometheus comes with a built-in alerting system that allows users to define alert rules based on metrics thresholds or conditions. Alerts can be sent via various channels such as email, PagerDuty, or Slack.
Exploring Grafana
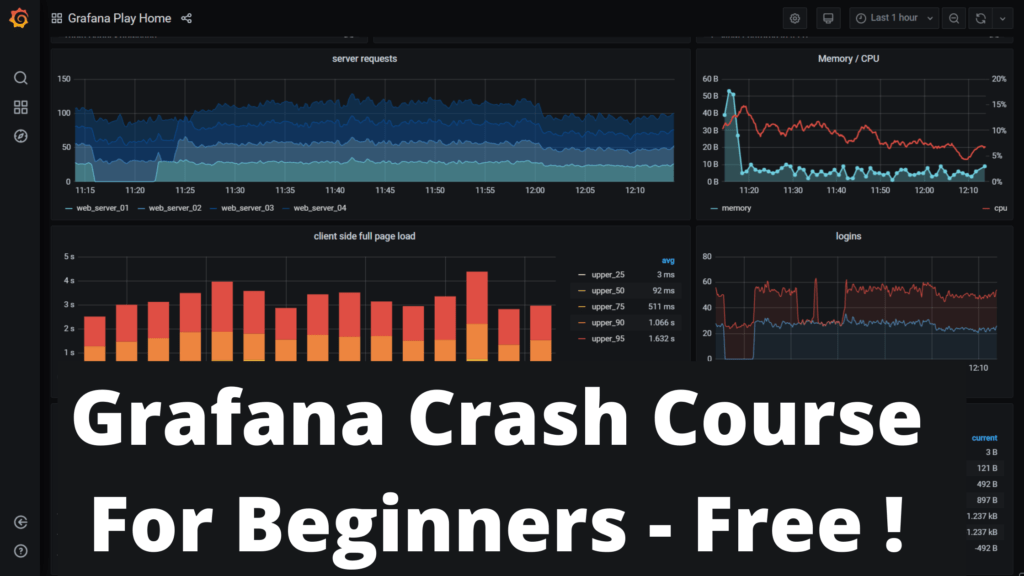
Grafana is an open-source analytics and visualization platform that complements Prometheus by providing rich visualizations, dashboards, and alerting capabilities. It supports a wide range of data sources, including Prometheus, allowing users to create unified dashboards for monitoring multiple systems.
- Visualization: Grafana offers a variety of visualization options, including graphs, charts, tables, and heatmaps, making it easy to create informative and interactive dashboards.
- Dashboards: Grafana’s dashboard editor provides a user-friendly interface for creating and customizing dashboards. Users can arrange panels, add annotations, and configure variables to create dynamic and insightful visualizations.
- Alerting: Grafana’s alerting feature allows users to set up alerts based on metrics queries and thresholds. Alerts can be configured to send notifications via email, Slack, or other channels.
Key Differences and Considerations
While both Prometheus and Grafana are essential components of a modern monitoring stack, they serve different purposes and have distinct strengths:
- Data Collection: Prometheus excels in data collection and scraping metrics from various sources, making it well-suited for monitoring infrastructure and applications in dynamic environments.
- Visualization and Analysis: Grafana shines in data visualization and analysis, offering a wide range of visualization options and dashboarding capabilities that enable users to gain insights from their metrics data.
- Integration: Prometheus and Grafana are often used together as part of a comprehensive monitoring solution. Grafana provides a powerful front for visualizing Prometheus metrics, enabling users to create unified dashboards that incorporate data from multiple sources.
Conclusion
In conclusion, Prometheus and Grafana are powerful tools that play complementary roles in monitoring and observability. While Prometheus excels in data collection and alerting, Grafana provides rich visualization and analysis capabilities. By leveraging the strengths of both tools, organizations can build robust monitoring solutions that enable them to gain insights into the performance and health of their systems.
References
- Prometheus: Prometheus Website
- Grafana: Grafana Website
- PromQL: Prometheus Query Language Documentation
- Grafana Alerting: Grafana Alerting Documentation
- Grafana Dashboarding: Grafana Dashboarding Documentation


