In this article I am going to show you how you can configure Grafana Email Alerts and Change Default Template. Please notice that in this article we have install Grafana on a Windows server. However, Steps are going to exactly the same regardless of which Operating System you have installed Grafana to.
For Video Tutorial Lovers
Grafana SMTP Integration To Send Email Alerts From Grafana
First and foremost step is that you should have SMTP details. You are going to get SMTP details from the project which you are working in. It might be provided to you by your client, so get in touch with them.
However if you want to Integrate SMTP for learning purpose then there are many SMTP providers are available. They provide you SMTP details with limitations of sending few free emails every day. You can google about Free SMTP Providers.
Adding SMTP Details in Grafana Configuration File
Open Grafana configuration file which by default is available at below locations depending on the Operating System Type:
- For Windows It is available at this location: C:\Program Files\GrafanaLabs\grafana\conf\Defaults
- For Unix/Linux it is available at the following location: /etc/grafana/grafana.ini
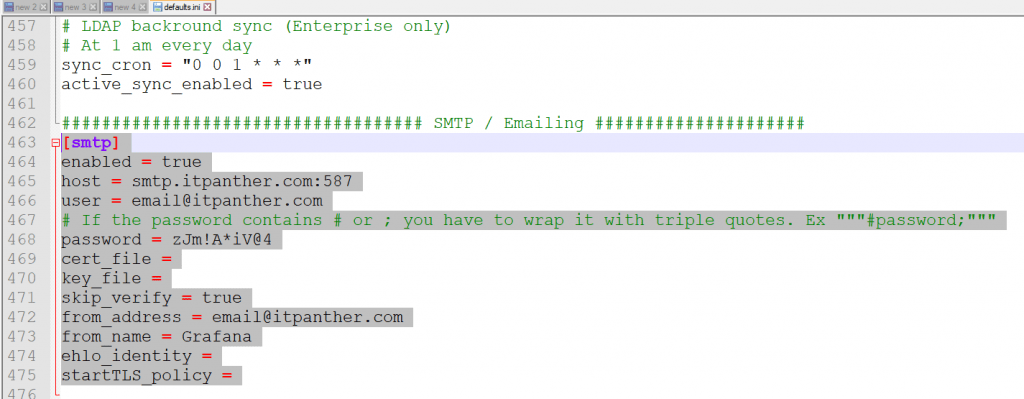
Required SMTP Details:
Below are the SMTP details which I have received from my provider, so I have updated that here. In your case, SMTP details will be different. Important thing to notice here is that you will have to change enabled = true for remaining changes to take effect.
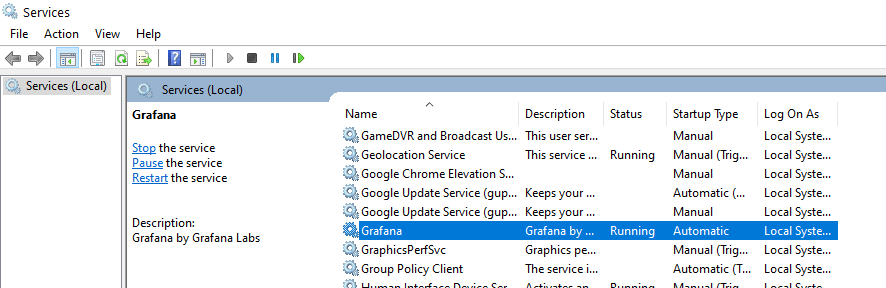
Restarting Grafana Services
After making any changes in the configuration file, we need to restart Grafana Services. Changes take effect only after restart of Grafana Services. So for windows you can restart Grafana services by going to services management console as shown below.
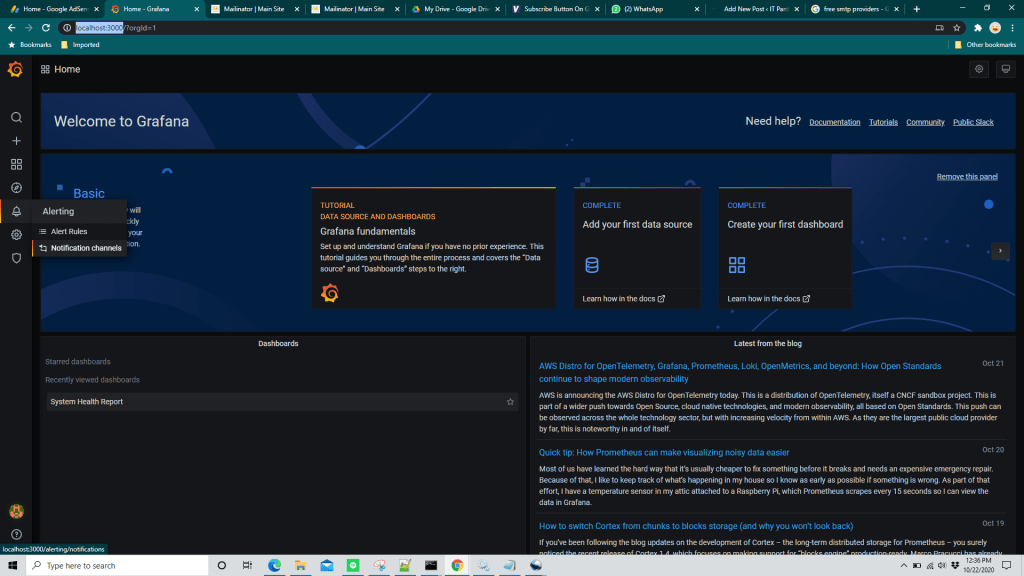
Creating Alert Notification Channel In Grafana
Open Grafana (default URL is http://localhost:3000 )and from the left pane, select Alerting->Notification Channels as shown in below example.
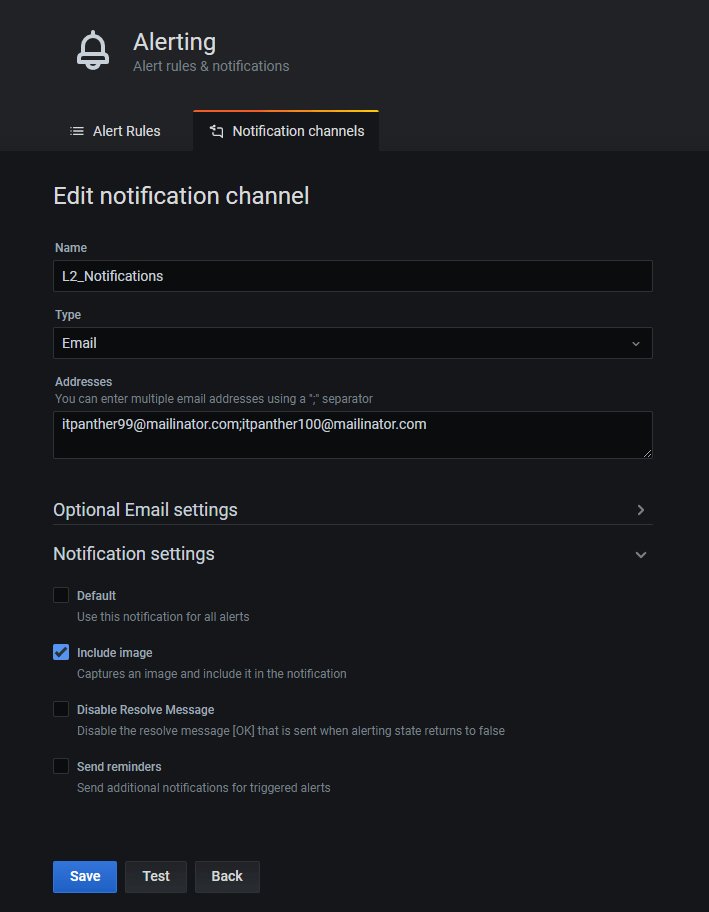
Provide Notification Channel Name, Type and Addresses. You can provide multiple email addresses by separating them with a semicolon. In the notification settings, select “Include Images” to send panel images in the email body.
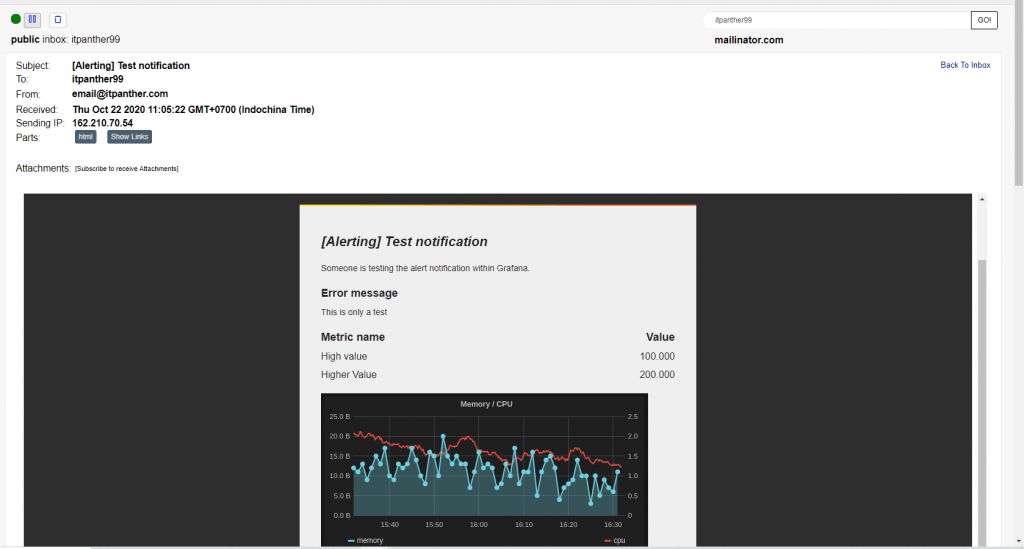
Click on “Test” and Grafana will send a Test email to confirm that Email settings are working properly. Here is the sample email which I have received.
Adding alerts in Grafana Panels
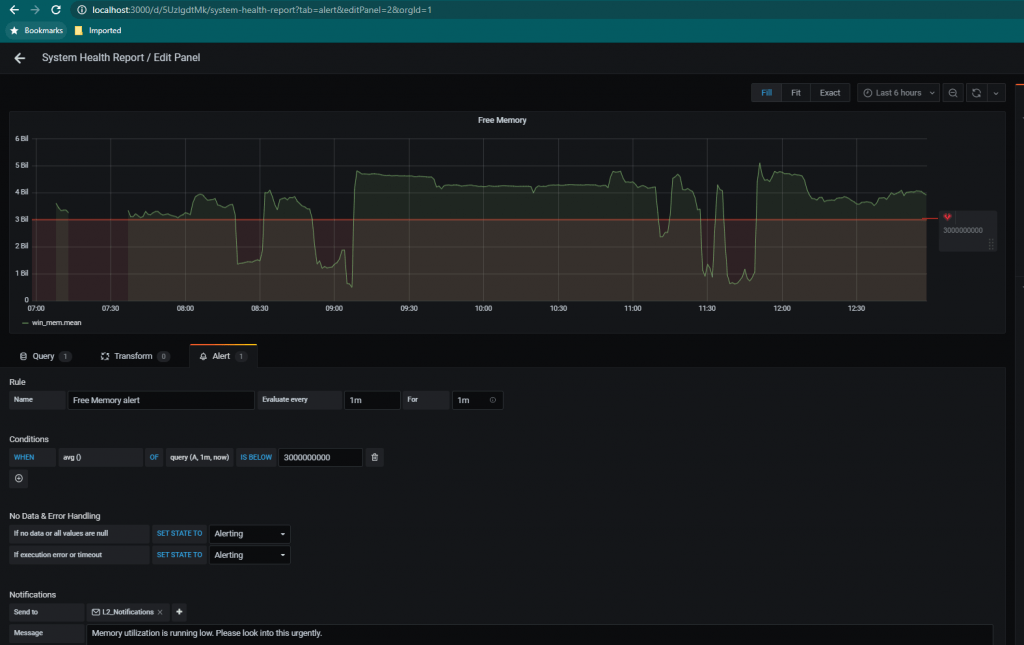
After you successfully create a working Email Notification Channel you can add alerts in your Grafana Panels. For this, go to alerts tab of any Grafana panel. Below is a sample which sends an email alert whenever free memory goes down to less than 3,000,000,000 bytes.
In the Notification select the newly created Notification Channel, and in “Message” you can type the message you want to see in the email body.
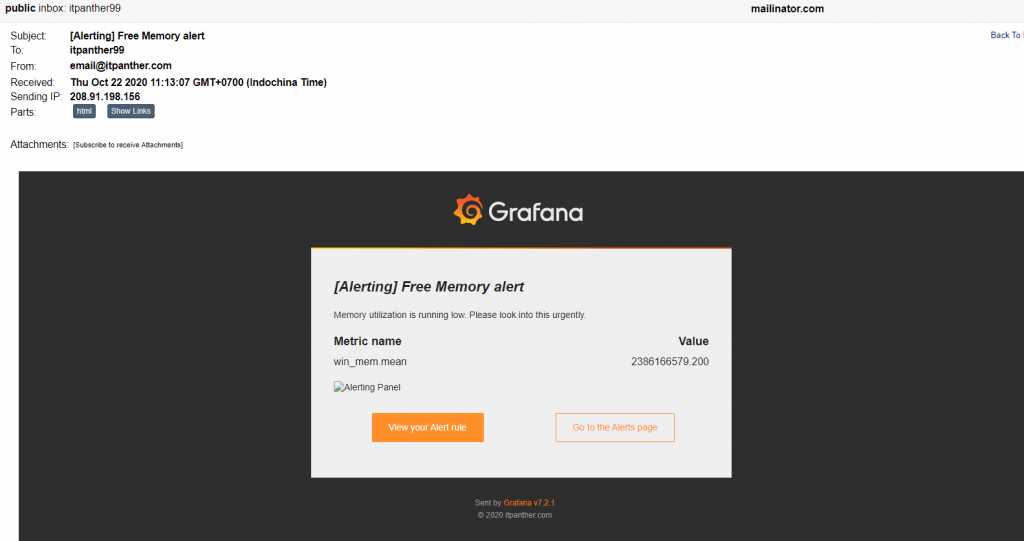
That is it. Save it and now you should receive an email whenever value goes below threshold based on the rule you have defined.
Default Email Alert Template
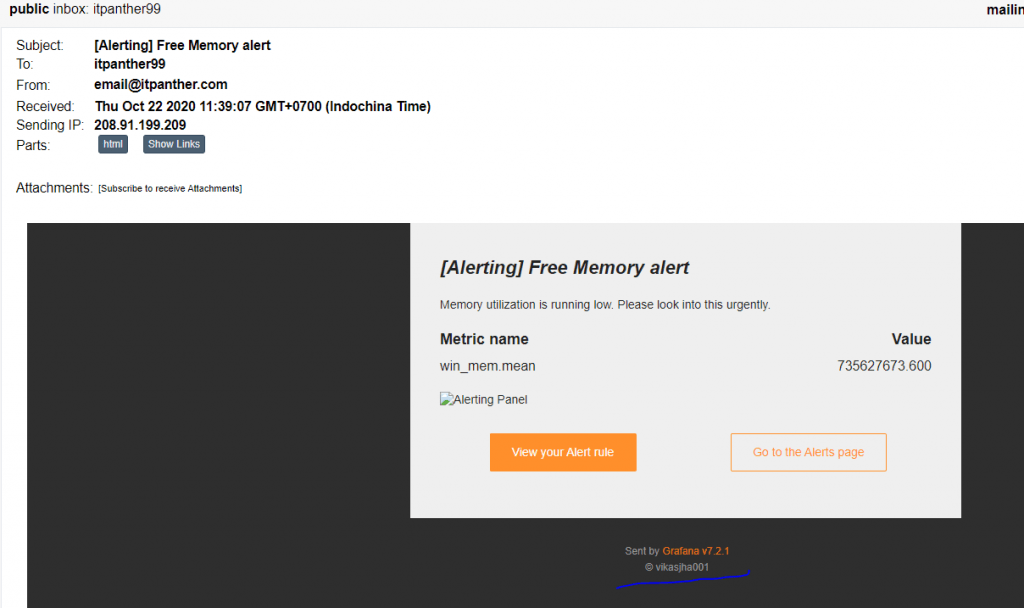
Default email alert will look like below. But don’t worry you can change the default template and I will show you how.
Changing Default Email Template
All the notification email templates are kept at below locations based on the type of Operating System.
Windows Default path: C:\Program Files\GrafanaLabs\grafana\public\emails\
Unix/Linux Default path: /etc/grafana/public/emails/
Changing Default Email Template
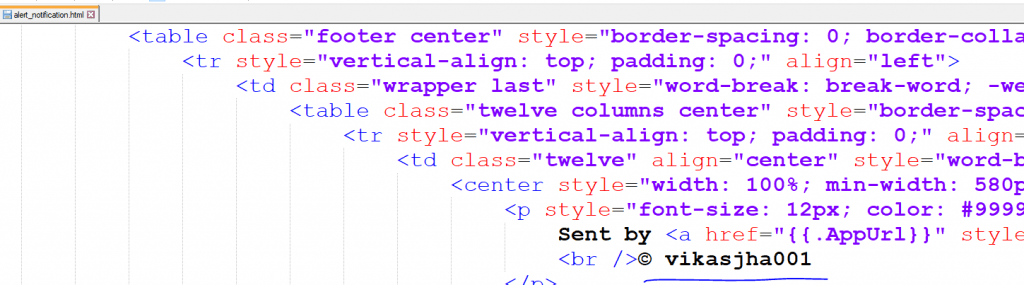
Open alert_notification.html file and make changes in this file based on your requirement. In this example I am just making one word change in the footer. I am changing Copyright information from default (Grafana Labs) to vikasjha001 (which is my youtube channel username as well).
Restart Grafana Services
Whenever you make any changes in Email Templates, you will have to restart Grafana. Changes will take effect immediately after a successful start of Grafana Services. Here is the email alert I received after making the change.
Hopefully you liked this article. You can continue reading more about Grafana here.
- Run Grafana on a Public Domain using Nginx ProxyIn this article, we are going to learn to run Grafana on a public domain say something like https://<your_web_domain/>. Here is the high level steps which we will follow: For the first two steps, please follow this article: Launching an EC2 Instance on AWS and Installing and Running Docker on EC2 Run Grafana on Docker… Read more: Run Grafana on a Public Domain using Nginx Proxy
- Master Top 60 Grafana Interview Questions and AnswersIn this article, we are going to discuss about frequently asked Grafana Interview Questions and Answers. Beginner-Level Grafana Interview Questions and Answers What is Grafana? Grafana is a multi-platform open-source analytics and interactive visualization web application. It provides charts, graphs, and alerts for the web when connected to supported data sources. Is Grafana an Opensource?… Read more: Master Top 60 Grafana Interview Questions and Answers
- What is the default username and password for Grafana login page?In this article, we are going to discuss the default username and password for the Grafana web login page. Default Grafana Username admin Default Grafana Password admin Default Grafana Web URL Default URL for Grafana is: http://server_name_or_ip:3306/login Default Grafana Database Grafana uses SQLite as a default database. Default Grafana Config File Location /etc/grafana/grafana.ini Steps to… Read more: What is the default username and password for Grafana login page?
- Jira Grafana DashboardIn this “Jira Grafana Dashboard” Video, I am going to show you how to create a Jira dashboard in Grafana using Jira APIs. Grafana opensource doesn’t have any plugin to connect to Jira directly, so we are going to create our custom program using Python. Python program to connect to Jira APIs Here is the… Read more: Jira Grafana Dashboard
- Prometheus vs. Grafana: A Comprehensive Comparison for Effective Monitoring and VisualizationIn the realm of observability and monitoring, Prometheus and Grafana stand out as two powerful tools that play complementary roles in ensuring the reliability and performance of systems. While Prometheus excels in data collection and alerting, Grafana shines in data visualization and analysis. In this article, we’ll delve into the key features, strengths, and differences… Read more: Prometheus vs. Grafana: A Comprehensive Comparison for Effective Monitoring and Visualization
Comments are closed.